Poult Production and Placement:
The February 14th 2024 edition of the USDA Turkey Hatchery Report, issued monthly, documented 24.98 million eggs in incubators on February 1st 2024 compared to 27.61 million eggs on February 1st 2023* The February 2024 set was down 9.5 percent (2.63 million eggs) from February 2023 and 34,000 eggs (0.1 percent) less than the previous month of January 2024.
A total of 21.63 million poults were hatched during January 2024 down 1.77 million poults (7.5 percent) compared to 23.40 million in January 2023*. The January 2024 hatch was down 38,000 poults (0.2 percent) from the previous month of December 2023.
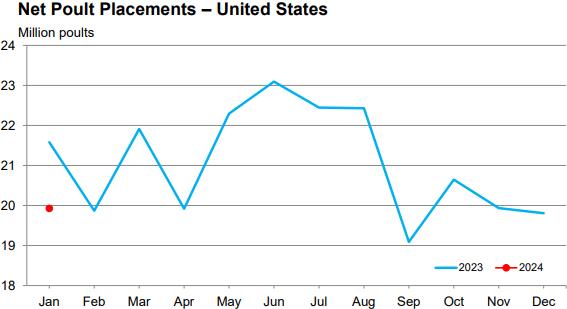
A total of 19.93 million poults were placed on farms in the U.S. in January 2024, compared to 21.58 million in December 2023*. The January 2024 placement was 7.7 percent, (1.63 million poults) less than in January 2023. This data confirms disposal of 1.70 million poults during the month. Approximately 7.9 percent of the January 2024 hatch was not placed.
For the twelve-month period February 2023 through January 2024 inclusive, 269.27 million poults were hatched and 251.37 million were placed. This confirms disposal of 17.89 million poults over the 12-month period, corresponding to 6.6 percent of all poults hatched.
* USDA revision from previous monthly report.
Turkey Production:
The February 23rd 2024 edition of the Turkey Market News Reports documented the following provisional data for turkeys slaughtered under Federal inspection:-
- For the processing week ending February 17th 2024, 1.609 million hens were processed at 16.5 lbs. live. This was 2.5 percent more than the 1.560 million hens processed during the corresponding week in January 2024 and 8.7 percent less than the 1.762 million processed during the corresponding week in January 2023. Hen slaughter year-to-date has attained 10.9 million, 6.4 percent less than for the corresponding period in 2023.
Ready to cook (RTC) weight for hens over the most recent week was 21.44 million lbs. (9,744 metric tons). This quantity was 4.6 percent more than the 20.50 million lbs. for corresponding week in January 2024 and 16.1 percent less than the 25.6 million lbs. during the corresponding week in February 2023. Dressing percentage was a nominal 80.5 percent. For 2024 to date RTC hen production attained 146.2 million lbs. (66,460 metric tons). This quantity is 13.4 percent less than for the corresponding period in 2023.
- For the processing week ending February 17th 2024, 1.995 million toms were processed at 44.8 lbs. live. This was 5.7 percent more than the 1.887 million toms processed during the corresponding week in January 2024 and 7.9 percent more than the 1.849 million during the corresponding week in February 2023. Year-to-date 13.48 million toms have been processed, 1.3 percent less than for the corresponding period in 2023.
Ready to cook (RTC) weight for toms during the most recent week was 72.0 million lbs. (32,718 metric tons). This quantity was 2.7 percent more than the 70.1 million lbs. processed during the corresponding week in January 2024 and 9.1 percent more than the 66.0 million lbs. during the corresponding week in February 2023. Dressing percentage was a nominal 80.5 percent. For 2024 to date RTC tom production attained 489.6 million lbs. (225,587 metric tons). This quantity is 1.1 percent less than the corresponding period in 2022.
Wholesale Prices
The National average frozen hen price for conventional birds during the past week was 89 cents per lb., down one cent per lb. (1.1 percent) from the corresponding week in January 2024 and down 50 cents per lb. from the three-year average of approximately 138 cents per lb. The following prices rounded to the nearest cent were documented in the new format report for domestic and export trading on February 23rd 2024:-
|
Product
|
cents per lb.
|
Change from previous Month (%)
|
|
Frozen hens whole Grade A
|
89
|
-1.1
|
|
Frozen toms whole Grade A
|
91
|
-1.1
|
|
Thighs (export)
|
104
|
+6.1
|
|
Necks (toms)
|
62
|
-9.2
|
|
Breasts 4.0-8.0 lb. (frozen)
|
105
|
+10.5
|
|
Breasts B/S (toms)
|
218
|
-2.2
|
|
Drums (toms)
|
70
|
+7.6
|
|
Wings (full-cut tom)
|
93
|
+9.4
|
|
Wing meat (with skin)
|
129
|
Unchanged
|
|
Thigh Meat (skin and boneless)
|
137
|
-0.7
|
|
Mechanically Separated (domestic)
(export)
|
41
37
|
-4.7
-5.7
|
Inventories:
On February 19th 2024 cold storage holdings at selected centers amounted to 98,462 lbs., 55.4 percent more than the inventory of 63,376 lbs. on February 1st 2024.
The February 26th 2024 edition of the USDA Cold Storage Report issued monthly, documented a total turkey stock of 302.1 million lbs. (137,338 metric tons) on January 31st 2024, equivalent to 1.6 weeks of normal seasonal RTE production of toms and hens and up 4.3 percent compared to the inventory on January 31st 2023. The January 31st 2024 value was 23.7 percent above the December 31st 2023 inventory. This change is consistent with seasonal demand.
- The Whole Turkey category of 116.1 million lbs. representing 38.4 percent of total storage of 302.1 million lbs. on January 31st 2024 was 55.1 percent higher than the adjusted inventory for the previous month and 11.6 percent higher than on January 31st
- Tom carcasses in storage increased by 20.5 percent from January 31st 2023 to 3.2 million lbs. on January 31st Tom carcasses increased 62.3 percent during January 2024 as compared to the previous month of December 2023 consistent with seasonal demand.
- Hen carcasses in storage increased by 2.0 percent from January 31st 2023 to 52.9 million lbs. on January 31st Hen carcasses increased 47.2 percent during January 2024 compared to the previous month of December 2023 consistent with seasonal demand.
- Breasts in storage increased 66.3 percent from January 31st 2023 to 74.8 million lbs. on January 31st 2024 and up 16.9 percent from the previous month of December 2023.
- The “Other” and “Unclassified” categories collectively amounted to 100.6 million lbs. or 33.3 percent of inventory on January 31st The magnitude of these two non-specified categories suggests that the USDA should attempt to classify product more accurately as to specific product.
 |
January 2024 Production
According to the USDA Poultry Slaughter Report released on February 22nd covering, January 2024, comprising 23 working days:-
- During January 2024, 16.4 million young turkeys were processed, 511,000 birds or 3.0 percent less than in January 2023;
- Total live weight in January 2024 attained 546.3 million lbs., 1.89 million lbs. or 3.7 percent less than in January 2023;
- Average live weight in January 2024 was 33.38 lbs., up 0.64 lb. or 2.0 percent more than in January 2023;
- RTC in January 2024 attained 431.5 million lbs., down 9.4 million lbs., or 2.1 percent from January 2023 with a yield of 80.0 percent;
- The proportion of frozen product in January 2024 attained 36.2 percent of total RTC produced;
- During January 2024 ante-mortem condemnation attained 0.35 percent of live weight, compared to 0.30 percent in January 2023;
- During January 2024, 1.50 percent of RTC weight was condemned compared to 1.19 percent in January 2023.
Comments:
The seasonal increase in stock in January 2024 inventory is evident.
The ratio of hens to toms slaughtered attained 1.0 to 1.2 year-to-date.
U.S. exports of turkey products in 2022 attained 184,837 metric tons, down 25.6 percent from 2021 (248,369 metric tons). Value decreased 3.6 percent to $642 million ($666 million in 2021). Unit price increased 29.5 percent from 2021 to $3,473 per ton.
Export data for turkey products during 2023 and the provisional production and consumption data for 2023 are posted in this edition. During 2023 volume of turkey exports attained 221,920 metric tons up 20.2 percent from the corresponding months in 2023. Value was down 2.0 percent to $628 million. Unit value was down 18.5 percent to $2,829 per metric ton denoting export of lower priced products.
From January 2022 through late-December 2023 losses of turkeys depleted as a result of HPAI attained approximately 14.1 million birds in eight states. This volume is equivalent to the combined production of toms and hens over 3.8 weeks with a nominal average production of 3.7 million harvested birds per week. Incident cases have continued in NC. and MO with losses attaining 90,000 growing birds this past week on four farms in the two states. Cases are occurring despite departure of migratory waterfowl southward along all four U.S. flyways over areas with concentrations of turkey production. This presumes local concentrations of non-migratory waterfowl or resident birds that are reservoirs and disseminators of virus.